Feature
Comprehensive analysis of nonprofit executive compensation sourced directly from IRS Form 990 filings. Compare pay across peer organizations, identify trends over time, and generate detailed reports.
Request a TrialEverything you need to analyze executive compensation across the nonprofit sector.
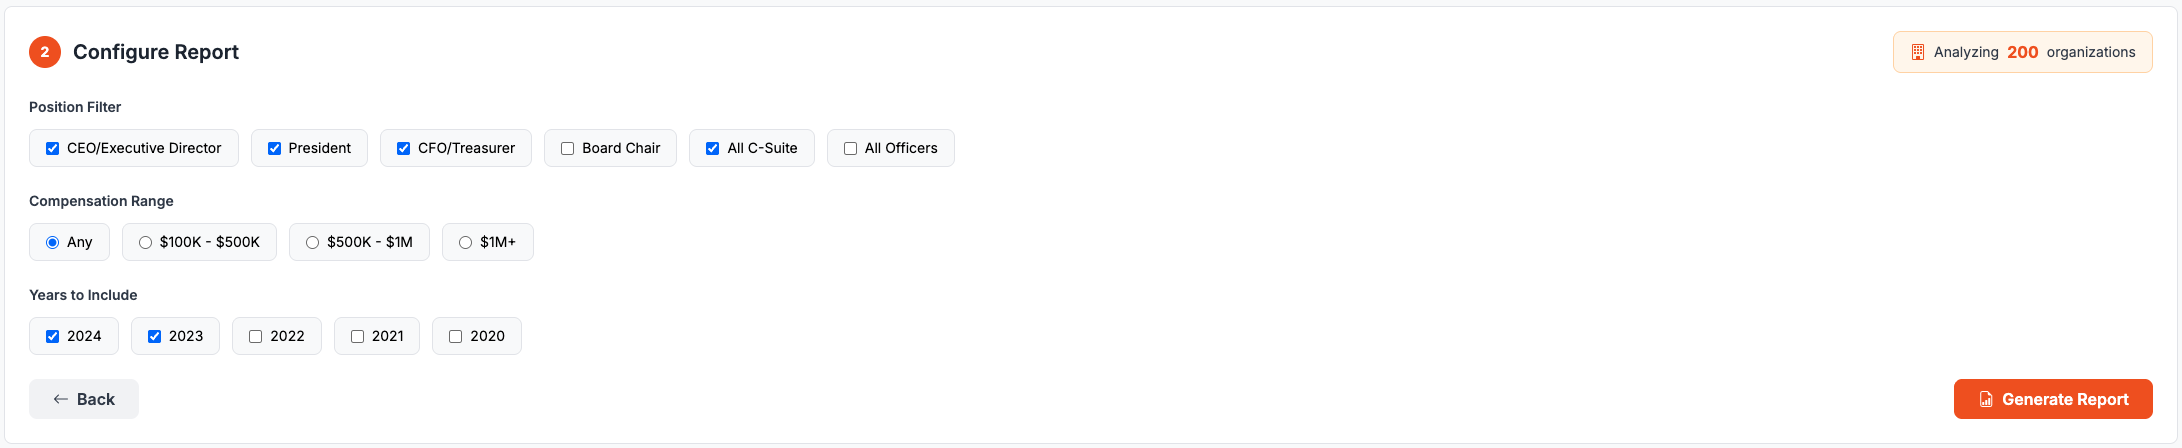
Build your analysis dataset from multiple sources:
Fine-tune your analysis with powerful filtering:
Download formatted Excel workbooks with:
Interactive visualizations to understand compensation patterns at a glance.
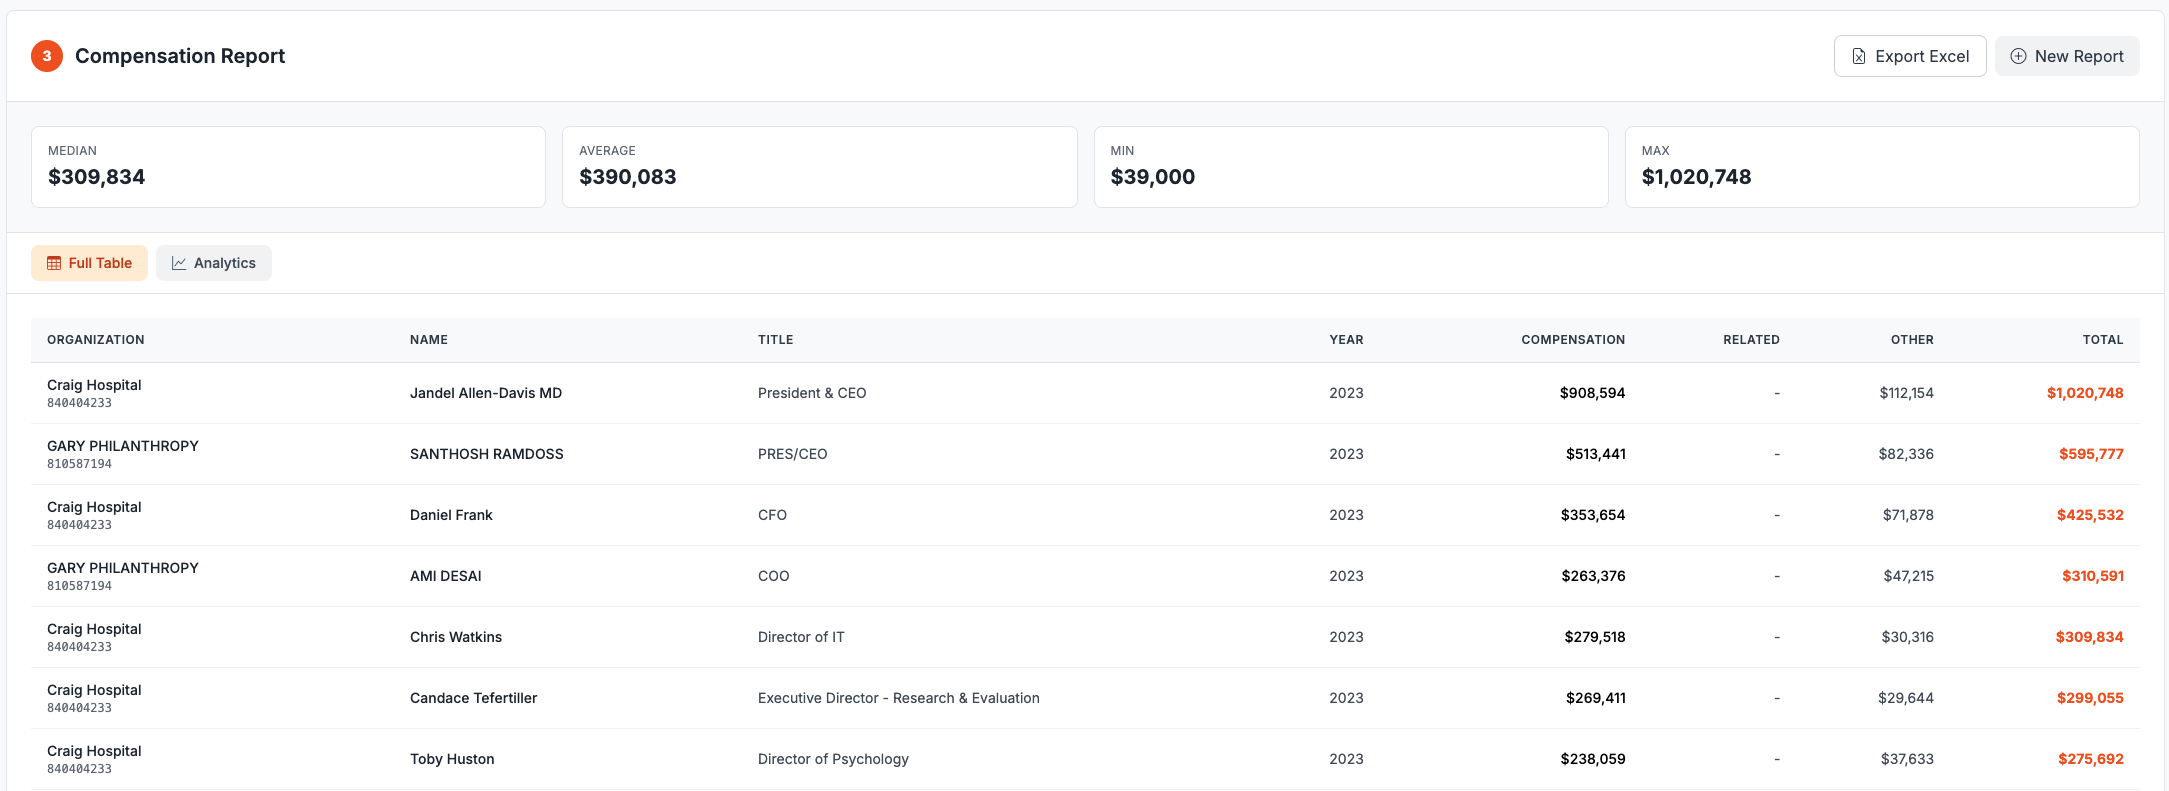
At-a-glance metrics for your selected dataset:
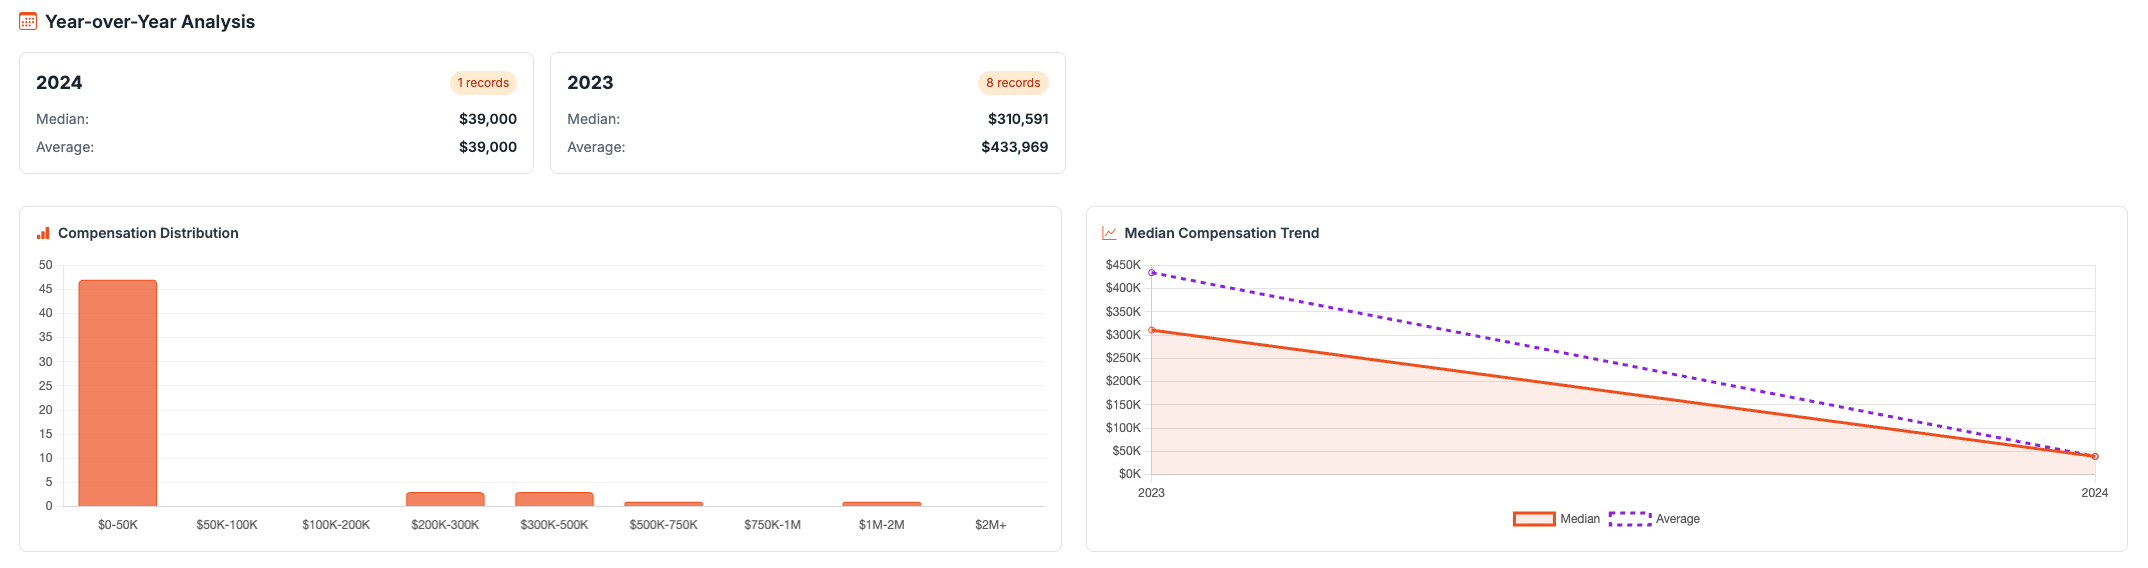
Detailed cards for each tax year showing total records, median, and average. Track compensation changes over time.
Histogram showing how many executives fall into each compensation range — from under $50K to over $2M.
Line chart tracking median and average compensation trends across selected years.
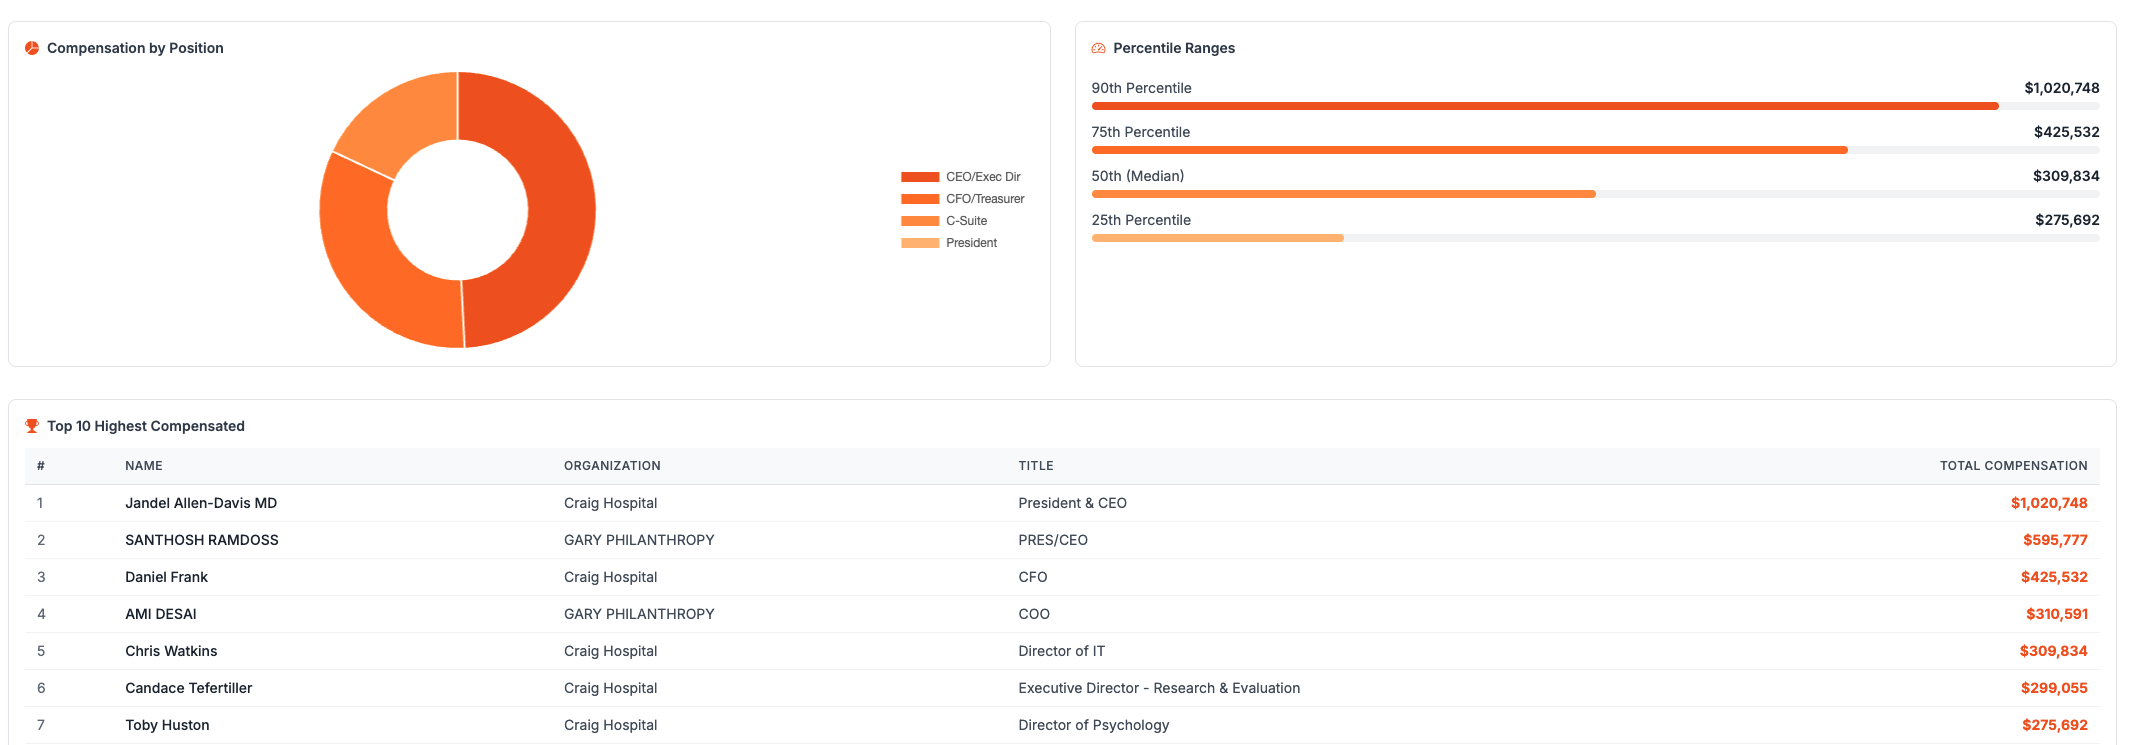
Doughnut chart breaking down average compensation by role — CEO vs CFO vs President and more.
Visual representation of 90th, 75th, 50th (median), and 25th percentile values.
Quick-reference table showing the 10 highest-compensated executives in your dataset with name, organization, title, and total compensation.
Access the complete dataset in a sortable, paginated table with organization, name, title, year, base compensation, related compensation, other compensation, and total.
Three ways to get started with Compensation Analytics.
Set competitive salaries for executive recruitment by benchmarking against peer organizations.
Support board compensation committee decisions with data-driven insights.
Evaluate overhead and executive pay at potential grantees before funding decisions.
Analyze compensation trends across sectors for academic or policy research.
Provide clients with data-driven compensation recommendations backed by 990 data.
All compensation data is sourced from official IRS Form 990 filings:
Includes base compensation, related organization compensation, and other compensation (deferred, nontaxable benefits, etc.).