Feature
Benchmark any nonprofit against a custom peer group across financials, efficiency ratios, executive compensation, grant activity, and more — powered by an 11-section analytics dashboard.
Request a TrialFour steps from search to insight.
Search by name or EIN. A profile card displays key financials — revenue, expenses, assets, contributions — along with NTEE code, location, and most recent filing year.
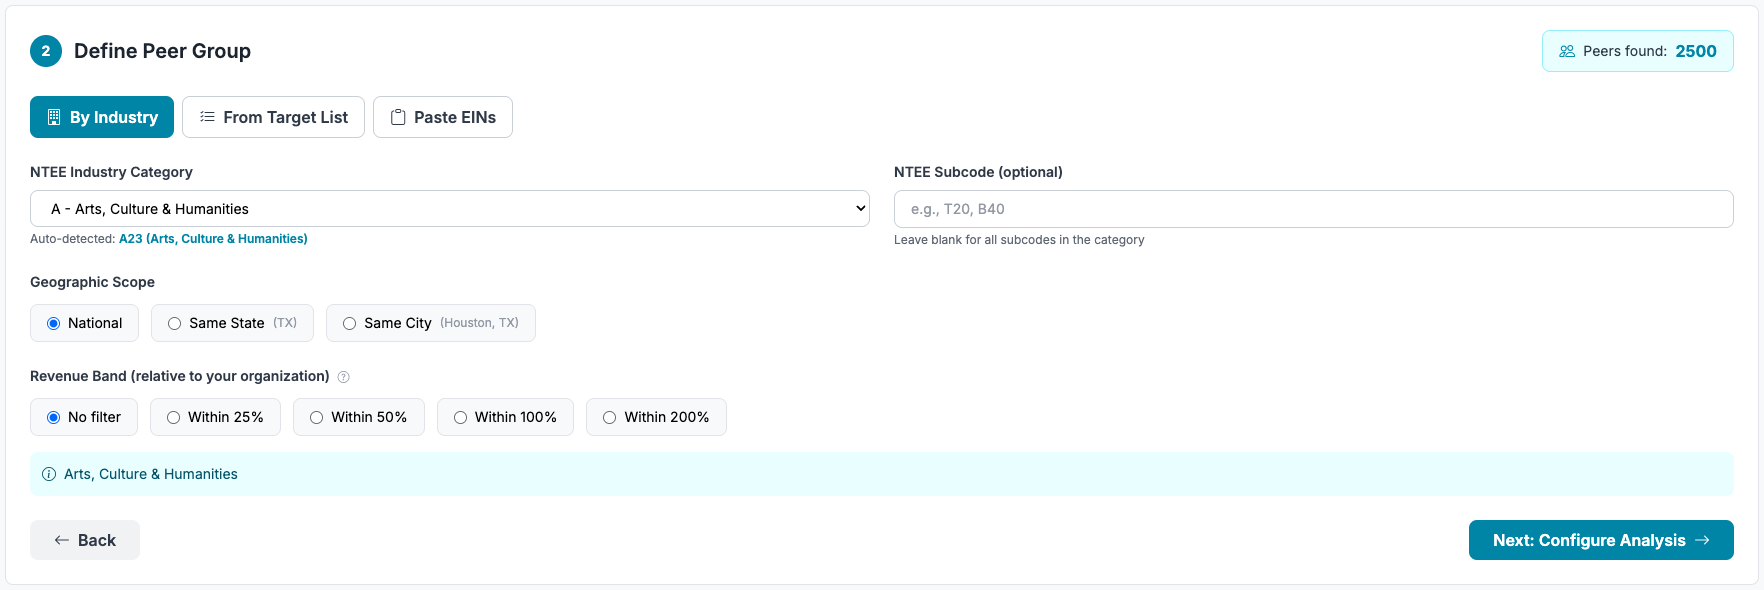
Choose one of three methods:
Select metrics (Revenue, Expenses, Total Assets, Net Assets, Contributions, Program Revenue) and tax years (2020–2024).
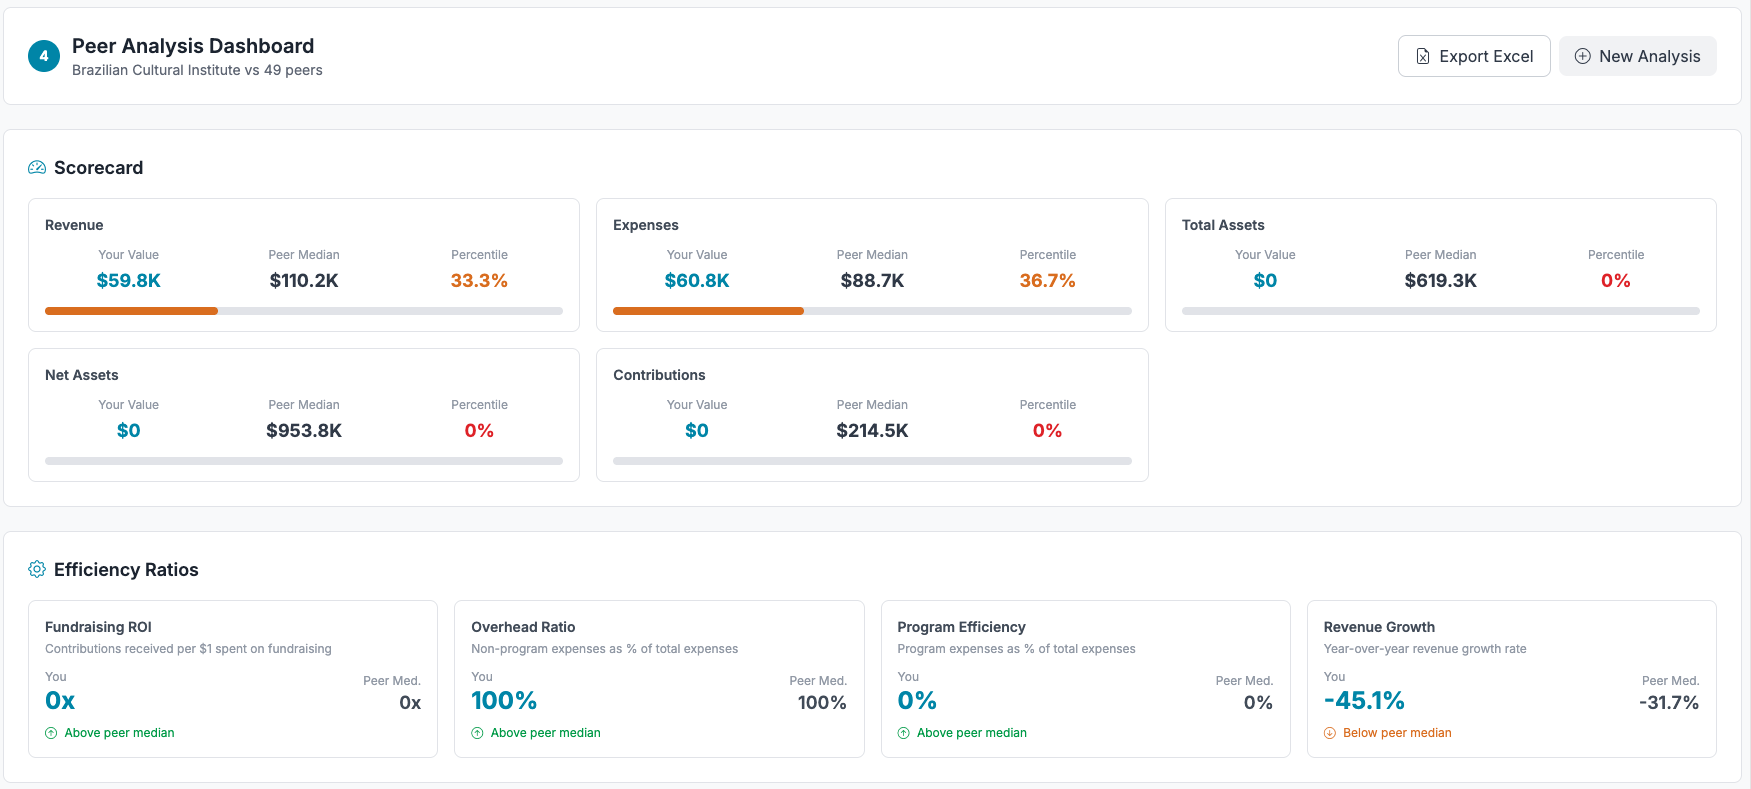
A scrollable 11-section analytics dashboard with interactive charts, percentile rankings, and a composite health score.
Every angle of nonprofit benchmarking in one view.
Cards for each metric showing your org's value, peer median, percentile rank (color-coded by quartile), and visual progress bars.
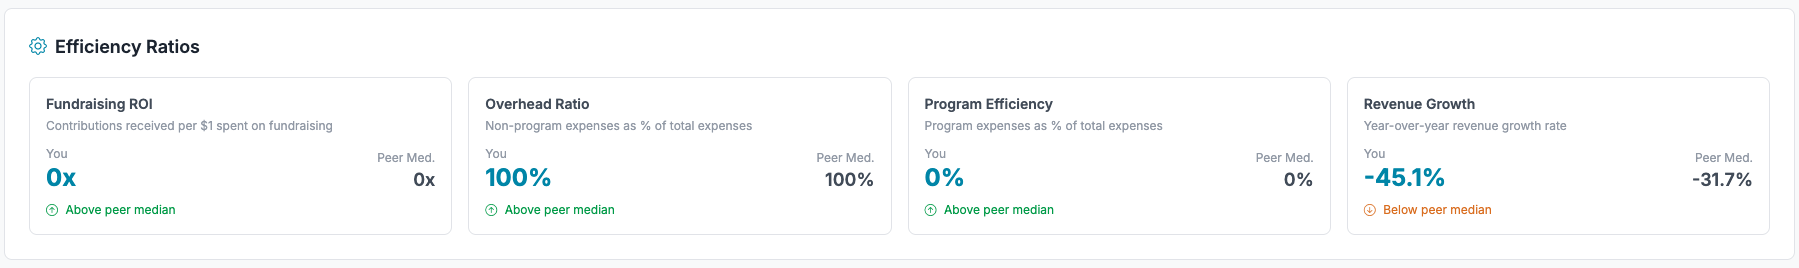
Four key ratios compared to peer median:
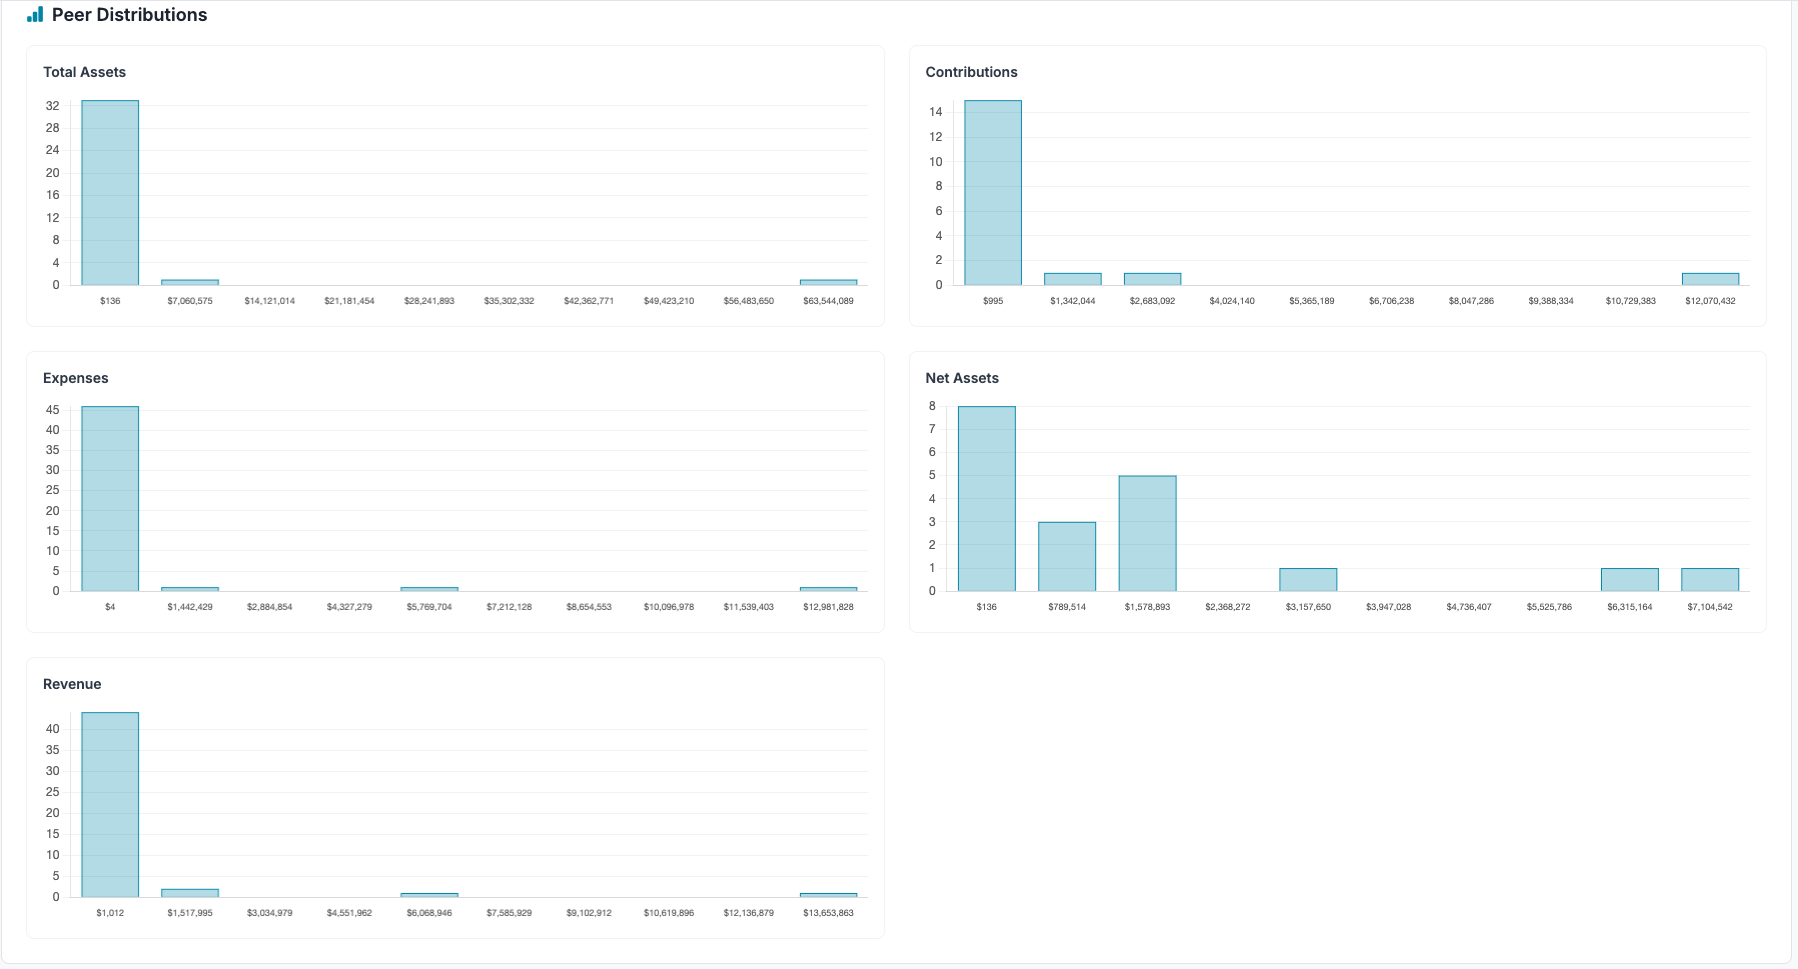
Histogram charts for each metric showing how peers are distributed, with your organization's position clearly indicated.
Line charts with three series: your org (solid teal), peer median (dashed gray), and peer average (dotted gray) across selected years.
Median values at three levels — National, State, and City — so you can see how compensation and financials vary by geography.
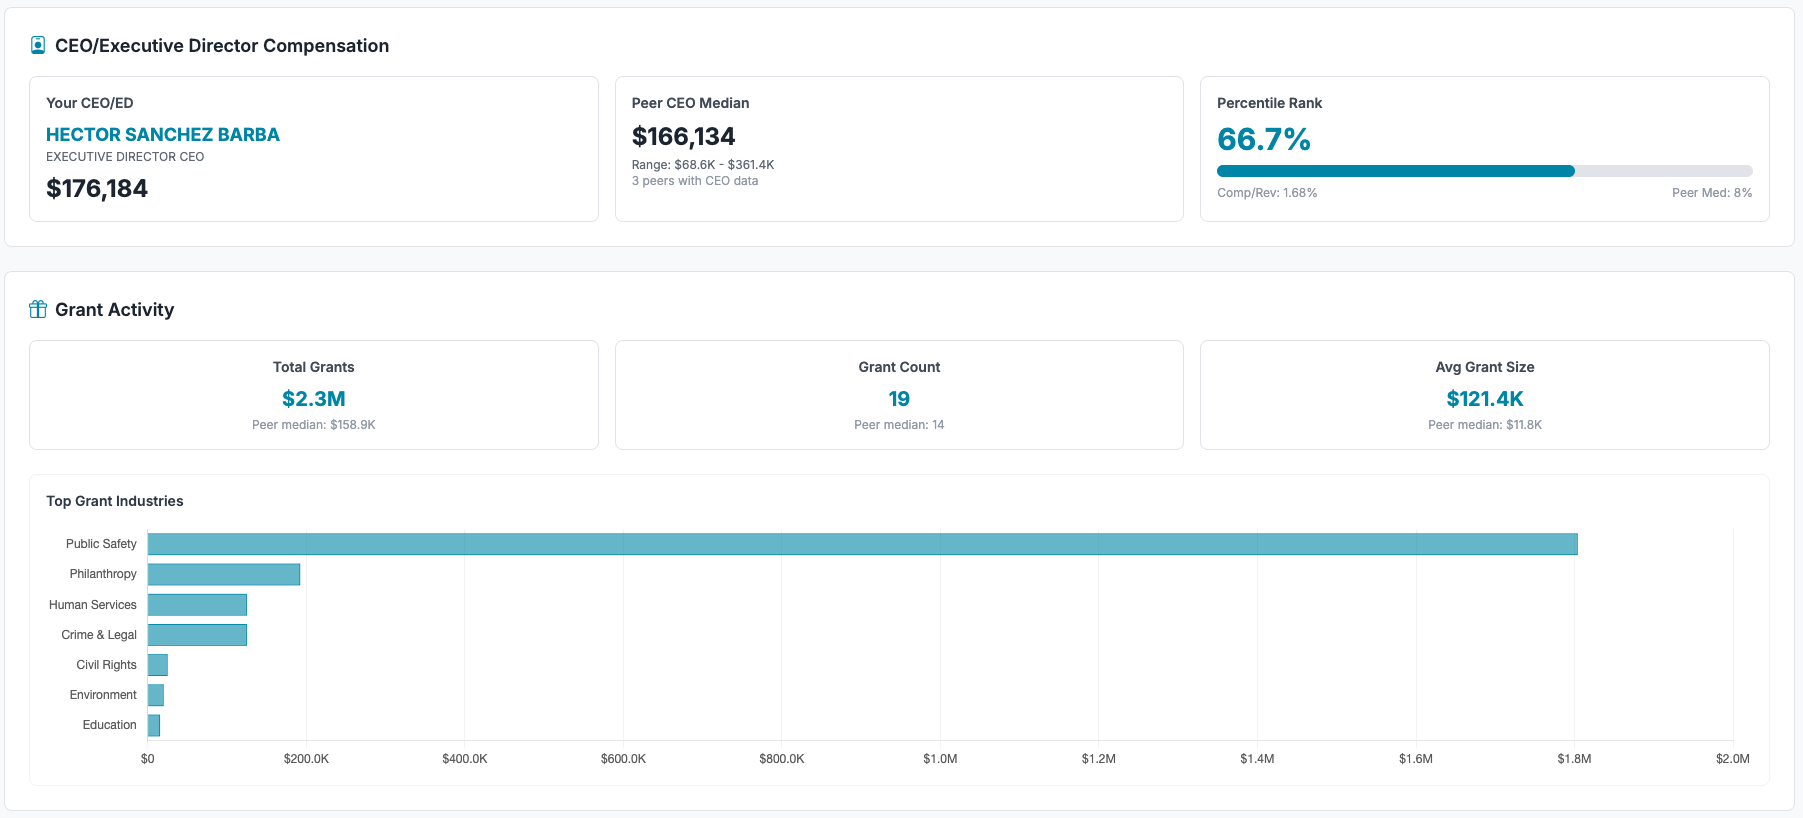
Side-by-side comparison of your CEO's total compensation vs peer median, with percentile rank and compensation-to-revenue ratio.
Total grant dollars, grant count, and average grant size vs peers. Plus a horizontal bar chart of your top 10 grant industries.
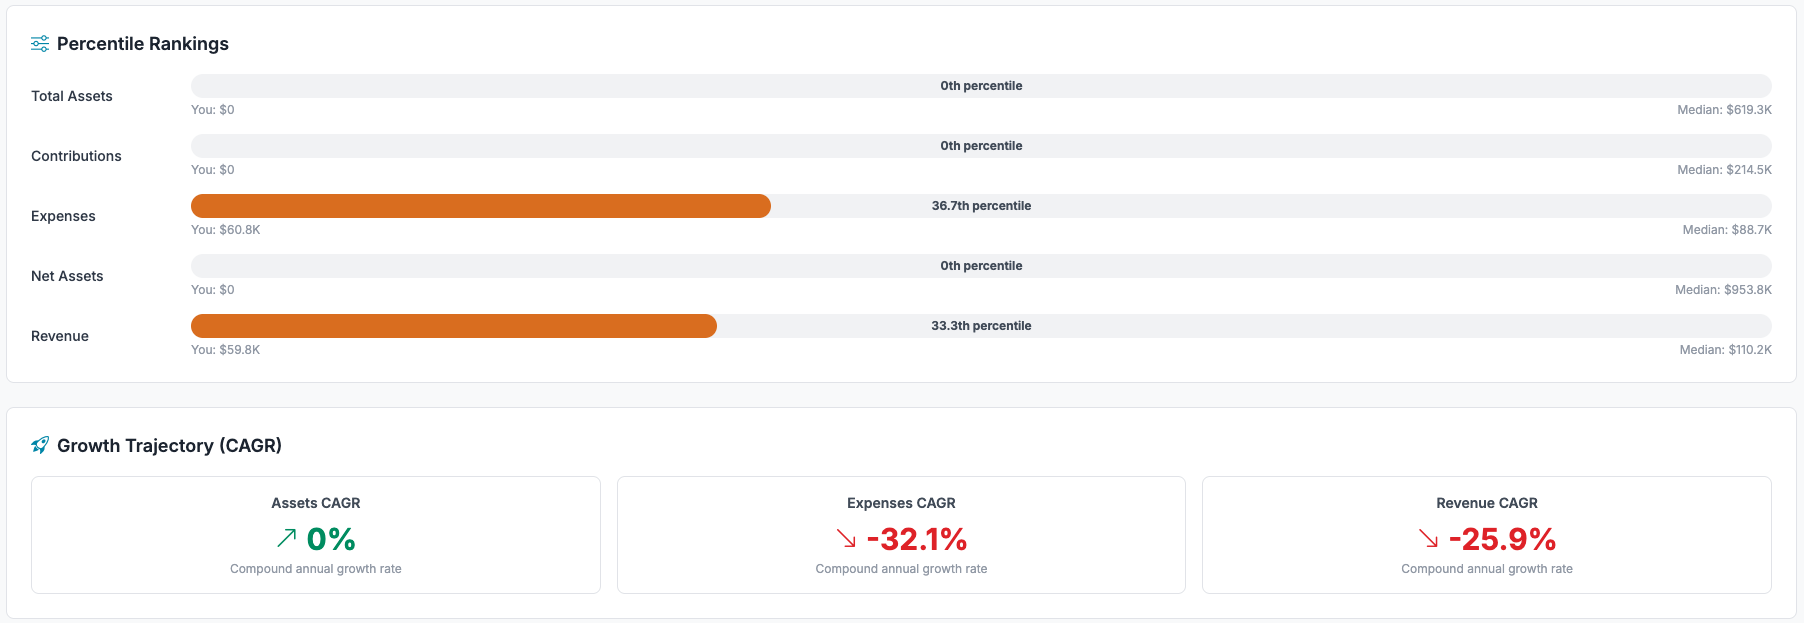
Full-width progress bars for each metric showing your 0–100 percentile position, color-coded by quartile with labeled values.
CAGR (Compound Annual Growth Rate) cards for Revenue, Expenses, and Assets with directional arrows across your selected year range.
A composite 0–100 score with letter grade (A–F) measuring operational efficiency and financial position relative to peers.
Five weighted components produce a single grade for any organization.
Program expenses as a percentage of total expenses. 75%+ is excellent.
Your revenue vs peer median. 2x the median scores 100.
Your net assets vs peer median. 2x the median scores 100.
Non-program expenses as a percentage of total. Below 10% scores 100.
Your contributions vs peer median. 2x the median scores 100.
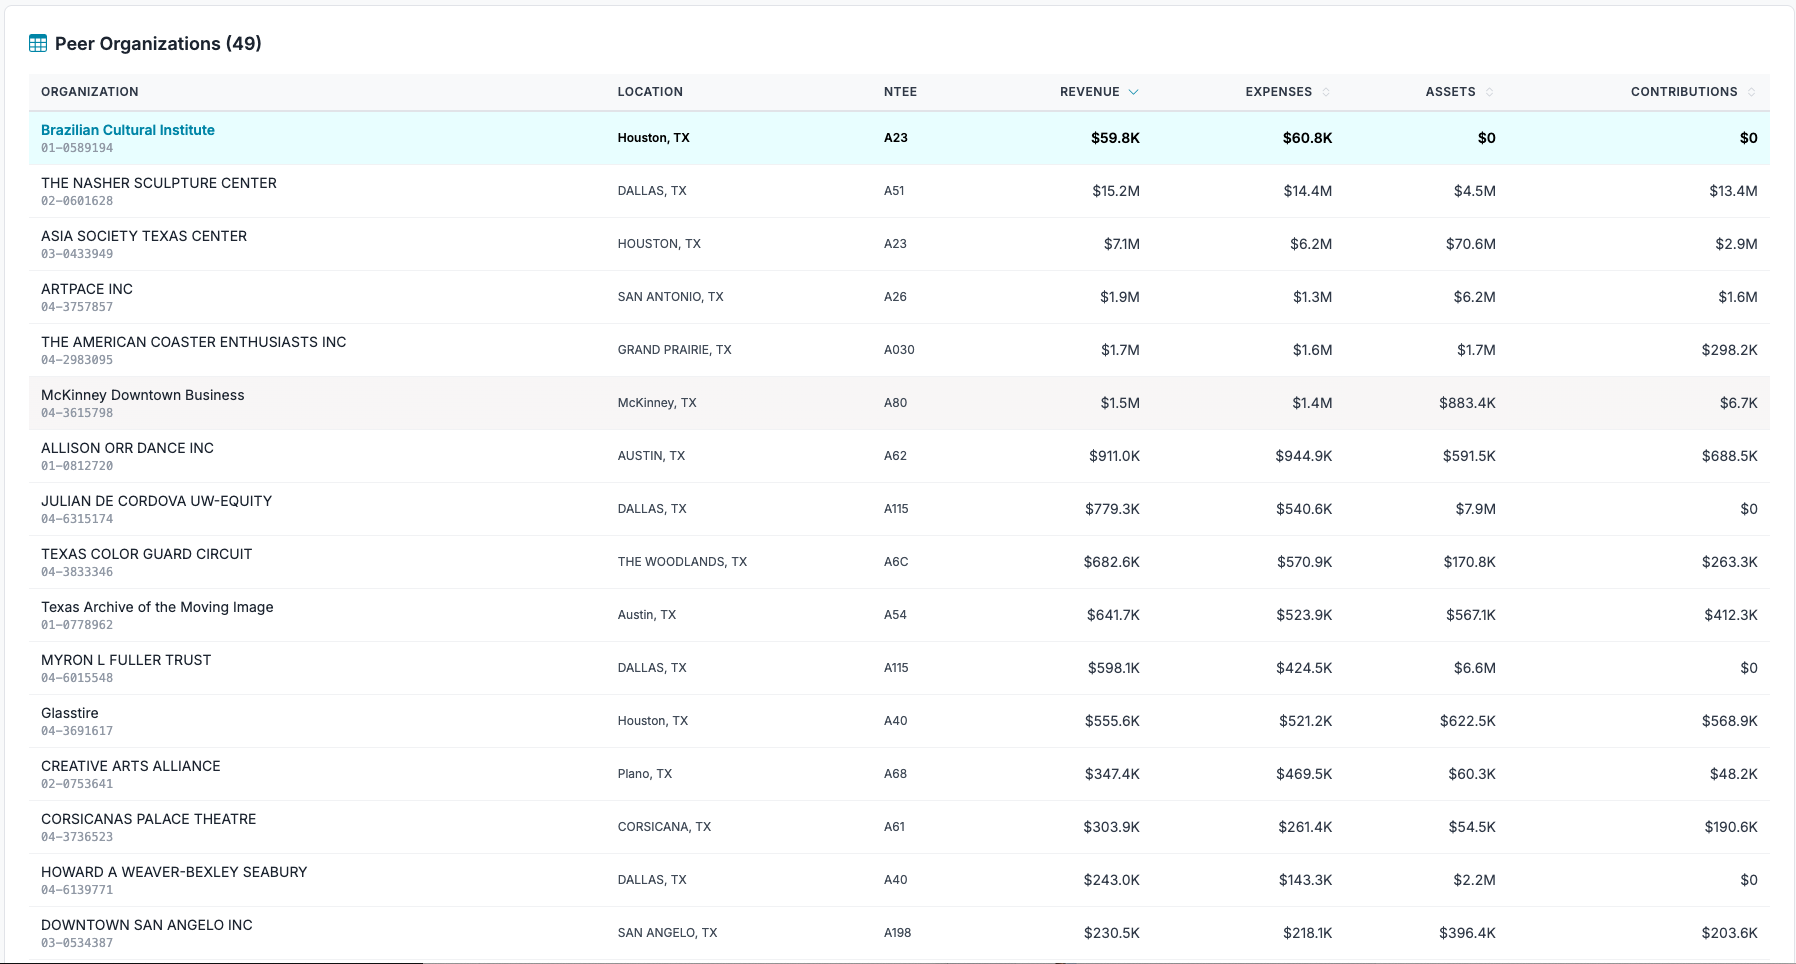
Sortable, paginated table of all peer organizations with name, EIN, location, NTEE code, and full financials. Your organization appears as a highlighted row at the top.
Download a formatted workbook with four sheets: Summary (scorecard, ratios, health score), Trends (year-by-year data), Peer Organizations (full list), and Grants (activity summary).
Peer Analysis draws from multiple datasets for comprehensive benchmarking:
Supports up to 2,000 peers per analysis.